Online
Mode S in the US
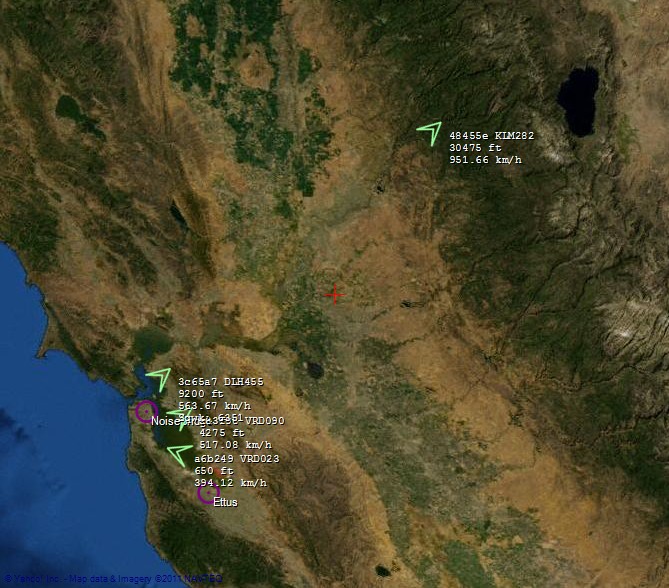
Sun, 24/07/2011 - 15:37 — balintSan Francisco & Silicon Valley:
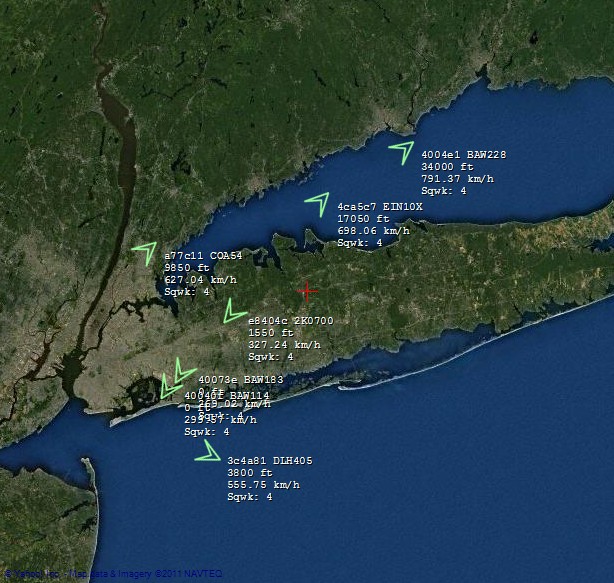
New York, New York:
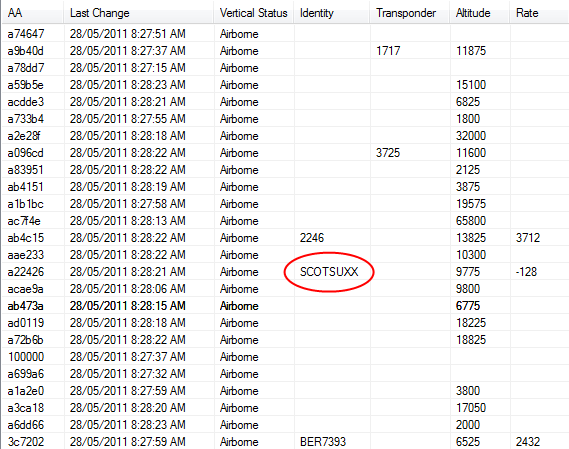
SCOTSUXX:
AviationMapper Demo
Tue, 24/05/2011 - 13:43 — balintAviation Mapper is LIVE! Click here to use it.
The Aviation Mapper launch video
Running live at Sydney Airport streaming AvMap via 3G mobile Internet
Running the Aviation Mapper desktop app
Presentation at Dorkbot Sydney Finale 2011
Presentation at Ruxcon 2011: "Hacking the wireless world with Software Defined Radio
Australian Geographical RadioFrequency Map
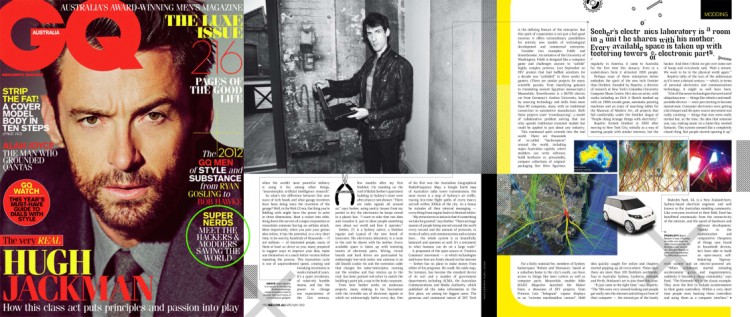
Tue, 15/06/2010 - 23:55 — balintRFMap featured in GQ Australia (April/May 2012)!
You can also have a listen to this podcast of a radio interview I did on with Ian Woolf on 2SER:
"Balint Seeber Mashed Up Radio"
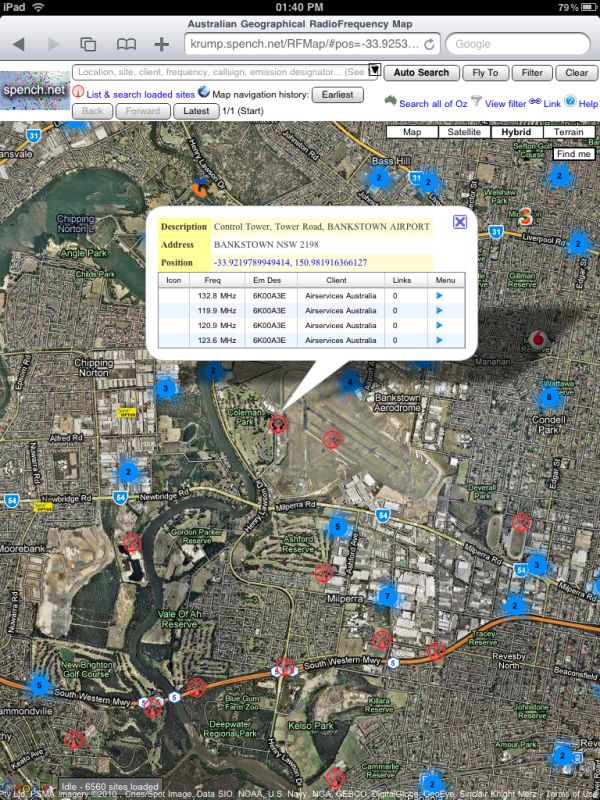
UPDATE: I have written an extensive guide with plenty of screenshots explaining how to use the map to the full. The contents of the guide can be found to the left of this text (at the top of this page's left-hand column). Read it if you wish, or dive right in. Alternatively, open two tabs/windows and go through the guide while trying it out live.
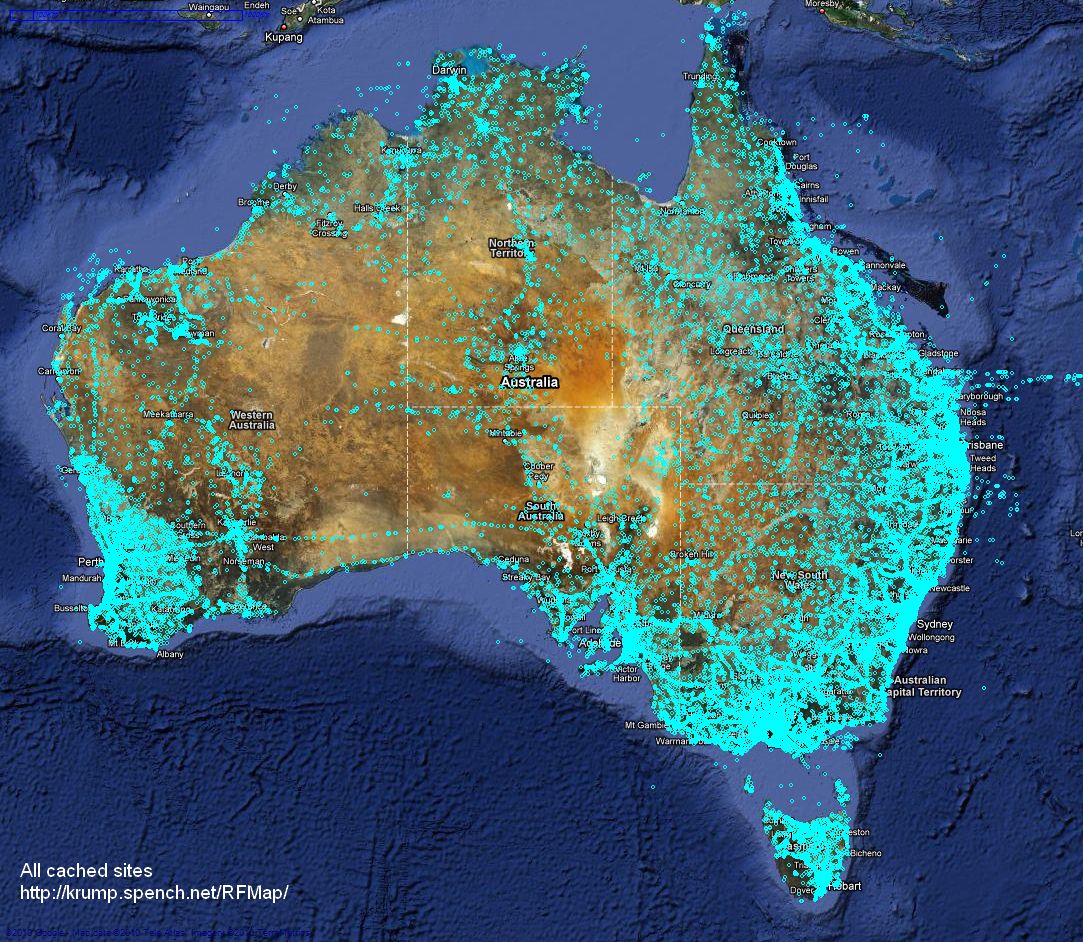
The Australian Geographical Radio Frequency Map is a site that overlays all registered RF transmitters on top of Google Maps. Generic antenna sites are shown with the red RF icon, while mobile base stations are represented by the carrier that operates from the site (often multiple carriers do, but currently the first is chosen when determining the icon). A mouse-over will give you the site's description, and a click will tell you who broadcasts from there, and at what frequencies. Much more is to come...
Although people by-and-large won't be terribly interested in the positions of every antenna in the country, they might be interested in checking how close they are to their nearest mobile base station, how good a carrier's coverage is in a particular area, and for prospective spectrum purchasers to assess possible interference, etc. However, having said all that, it is primarily in the ham spirit.
Here is every transmitter site cached in the database, which is fully searchable from the web interface (shown below) by location, site name, client details, frequency range, emission designator and callsign:
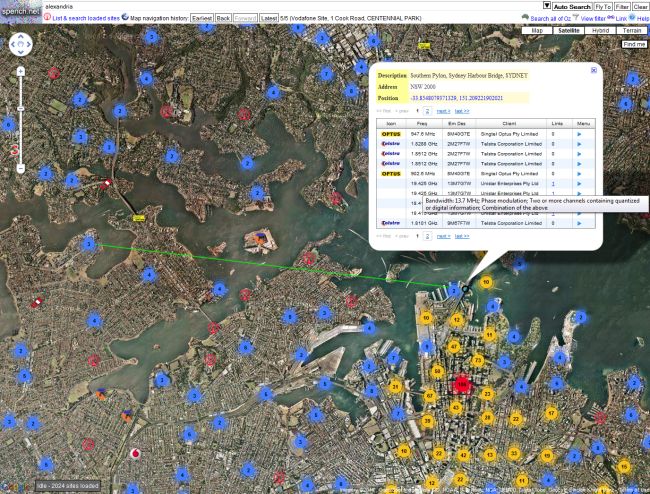
Here is a browser preview:
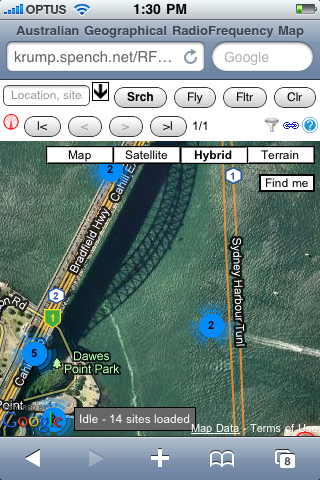
Here is what it looks like on the iPhone:
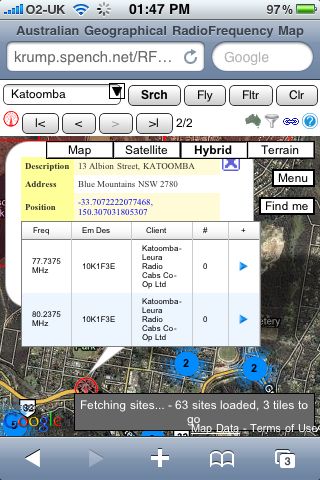
And on the iPad:
NISRP: the Non-Intrusive Song Rating Plugin for Winamp and iTunes
Thu, 04/03/2010 - 18:39 — balint| UPDATE: NISRP has now been added to the offical Winamp plugin catalogue! |
More information is available on my wiki.
Mapping Software
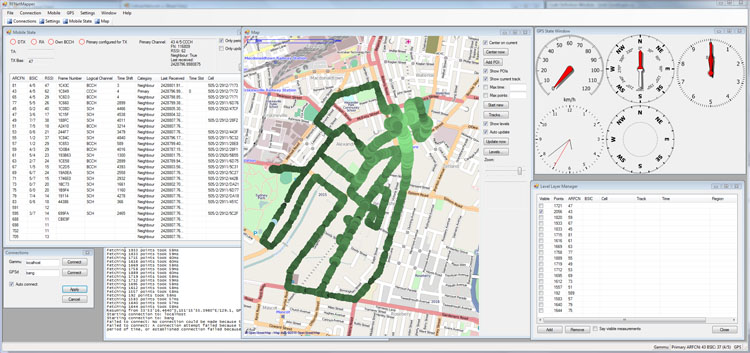
Wed, 24/02/2010 - 22:05 — balintThe mapping software brings all the data together and presents it on a map. Position and measurements are logged to a SQL database, and can be reviewed at will. The 'Level Layer Manager' allows customisation of data shown on the map. For example, one can choose to plot all measurements made on a particular ARFCN, and then further refine that to one cell by specifying the BSIC.
Collecting the data
Wed, 24/02/2010 - 18:04 — balintTwo streams of data are of interest: trace information from the mobile and position information from a GPS receiver.
To acquire position information, I used a commercial Navman device, which was modified to boot into WinCE and transmit NMEA data over a TCP connection (via Bluetooth Dial-Up Networking and GPS2Blue) to a virtual serial port on my laptop, which in turn was connected to gpsd. Full details can be found here.
Hardware
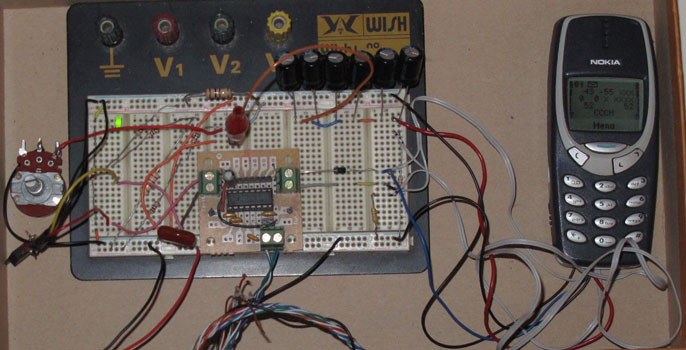
Tue, 23/02/2010 - 13:38 — balintAn old Nokia mobile with DCT-3 firmware (for network monitor mode) is required. The phone needs to be connected to a computer via its FBUS serial interface, so some level conversion hardware is also required. Since most modern laptops do not have an external serial port, an RS-232 to USB converter is also a good idea.
Geolocation Experiment using the Mobile GSM Cellular Network
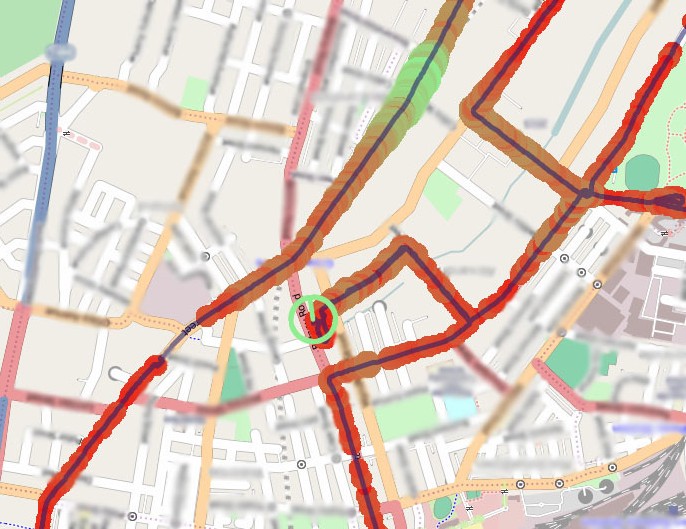
Tue, 23/02/2010 - 12:49 — balintThis experiment involved acquiring CellID and signal strength information from the GSM cellular network, tracking one's position while acquiring this data, and finally presenting it nicely. It is summarised in the following pictures (full details are described in the sub-sections found top-left):
Mapping position and signal strength measurements:
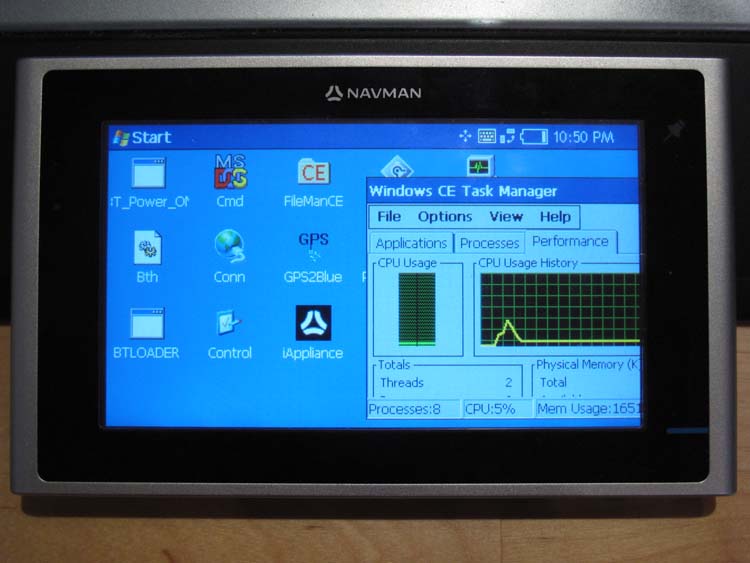
Turning the Navman S150 into a Bluetooth GPS receiver
Wed, 27/01/2010 - 14:18 — balintNavman GPS receivers, and the like, are great, until you actually want to use their received GPS data on a computer in real-time. Luckily there are plenty of resources to do this (NavmanUnlocked, the forum, MioPocket, GPSPasSion and GPSUnderground). In addition, I recommend SiRFTech for GPS testing. There are many tools available too, such as SSnap, which is extremely useful to track registry and filesystem changes. This is especially good when creating a one-off .reg file that you can import after a hard reset to restore the state of WinCE (in particular Bluetooth pairings).
Here, I give a quick guide to turning a Navman S150 into a Bluetooth GPS receiver that one can use with gpsd on a Bluetooth-enabled computer.
Behold the trusty S150 running WinCE Core 5 and PNADesktop (which is launched from \Program Files\Navman\appstartupsec.ini - the other apps, e.g. SmartST, are manually disabled):
My Contribution
Thu, 10/01/2008 - 12:33 — balintI wrote the following major system components:
- 1) A multi-threaded, load balancing MPEG-2 video decoder engine, featuring:
- Automatic memory management & caching
- Level-Of-Detail support and seamless transitions
- Continuous playback or shot looping (given cut information)
- Asynchronous loading and destruction
[Initial tests indicate it can play over 500 videos simultaneously on one computer (with 2 HT CPUs and 1GB of RAM at the lowest LOD). TVisionarium is capable of displaying a couple of hundred videos without any significant degradation in performance, but there's so much still to optimise that I would be surprised if it couldn't handle in excess of 1000.]
With my latest optimisations, TVisionarium is able to play back 1000 shots simultaneously!
While profiling the system, total CPU usage averages around 90-95% on a quad-core render node!
This indicates that those optimisations have drastically minimised lock contention and support far more fluid rendering.
Have a look at TVis in the following video:
This is an in-development 'video tube' test of the video engine:
(Watch it on youtube.com to leave comments/rate it if you like.)
Events
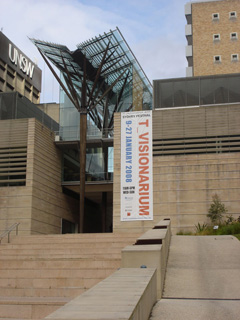
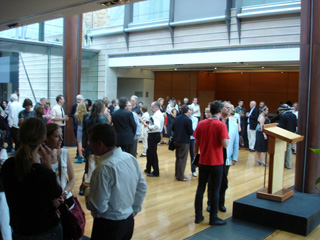
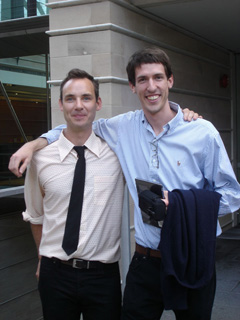
Thu, 10/01/2008 - 12:07 — balintT_Visionarium was officially launched on 08/01/2006 as part of the 2008 Sydney Festival. Please read my blog post about it. Here are some pictures:
The festival banner:
Crowd before the speeches:
The digital maestros (Matt McGinity & I):
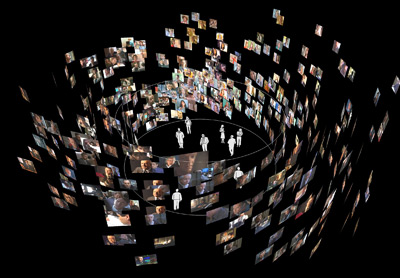
T_Visionarium (AKA Project TVisionarium Mk II)
Thu, 10/01/2008 - 11:35 — balintThis series of pages summarises the contribution I made to TVisionarium Mk II, an immersive eye-popping stereo 3D interactive 360-degree experience where a user can search through a vast database of television shows and rearrange their shots in the virtual space that surrounds them to explore intuitively their semantic similarities and differences.
It is a research project undertaken by iCinema, The iCinema Centre for Interactive Cinema Research at the University of New South Wales (my former uni) directed by Professor Jeffrey Shaw and Dr Dennis Del Favero. More information about the project itself, Mk I and the infrastructure used, is available online.
I was contracted by iCinema to develop several core system components during an intense one month period before the launch in September of 2006. My responsibilities included writing the distributed MPEG-2 video streaming engine that enables efficient clustered playback of the shots, a distributed communications library, the spatial layout algorithm that positions the shots on the 360-degree screen and various other video processing utilities. The most complex component was the video engine, which I engineered from scratch to meet very demanding requirements (more details are available on the next page).
Luckily I had the pleasure of working alongside some wonderfully talented people: in particular Matt McGinity (3D graphics/VR guru), as well as Jared Berghold, Ardrian Hardjono and Tim Kreger.
LED Display
Tue, 07/08/2007 - 12:18 — balintThanks to the generosity of Aras Vaichas, I came into possesion of an old (1992) 60x8 dual-colour LED display. As it was just the display itself (no manual, instructions, software, etc) I set about reverse engineering the board. Using my multimeter I re-created the schematic for the board and found all the relevant datasheets online. Having figured out how to talk to the display, I interfaced it via the parallel port and wrote some control software for it. Once I could display various test patterns (multi-colours sine waves), I 'net-enabled' the software so that the display could be controlled over a network via UDP packets - the resolution is so low that the entire LED configuration fits into a single packet! Finally, I wrote a plugin for Winamp that streams the frequency analysis of the playing song to the display, which produces results like this:
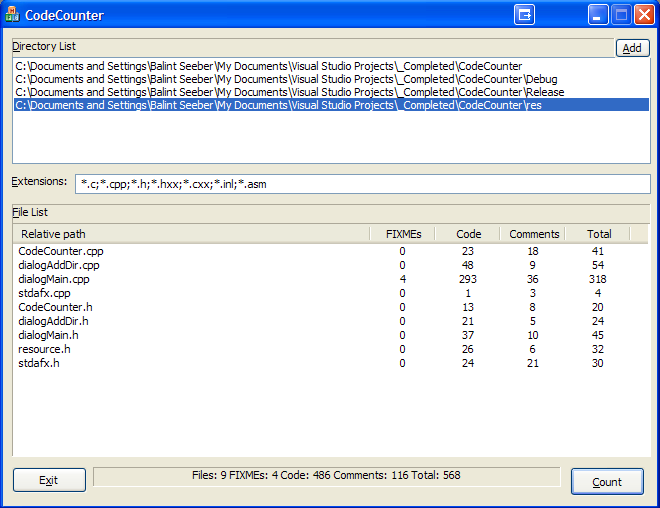
Counting Lines of Code
Mon, 30/07/2007 - 15:09 — balintAlthough there exists a plethora of programs that count lines of code, I thought I would write my own. It is designed to analyse C/C++ code and ignore whitespace, // and /**/ comments (both the single and multi-line sort). It also counts the number of FIXME's one has left in their code. Other languages (eg: Javascript, assembly) that also use such commenting conventions are compatible too.
Cosmology Major Project
Sat, 05/05/2007 - 13:46 — balint|
|
|

A system for distributed extensible particle simulations over multiple computers. Unfortunately I haven't exactly got around to distributing it. Although thanks to the generosity of Steven Foster, the many lab computers at my school are waiting. My report details the process and simulation design.
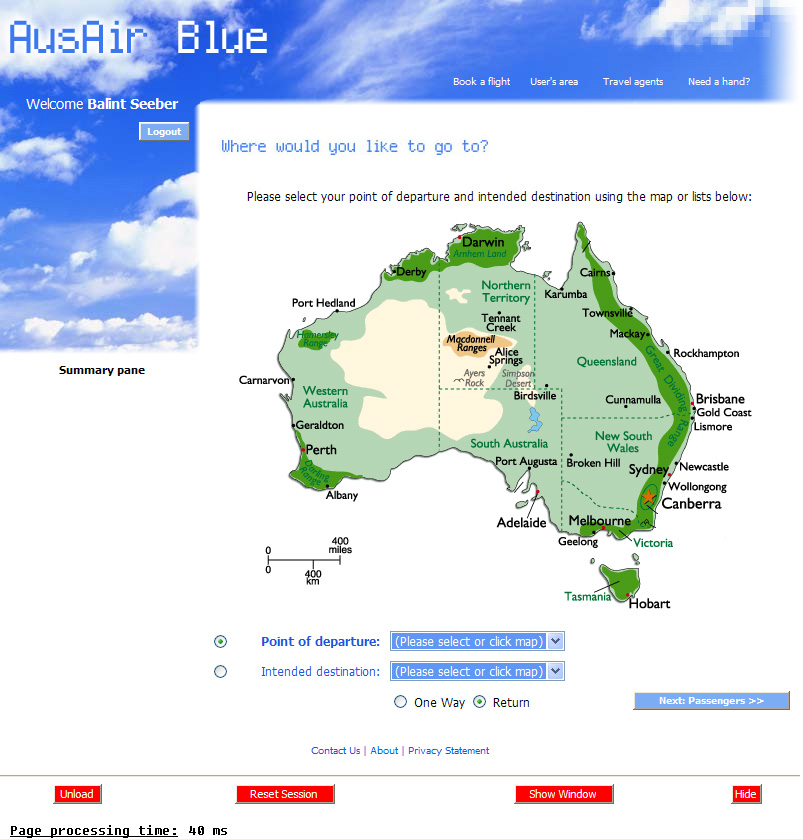
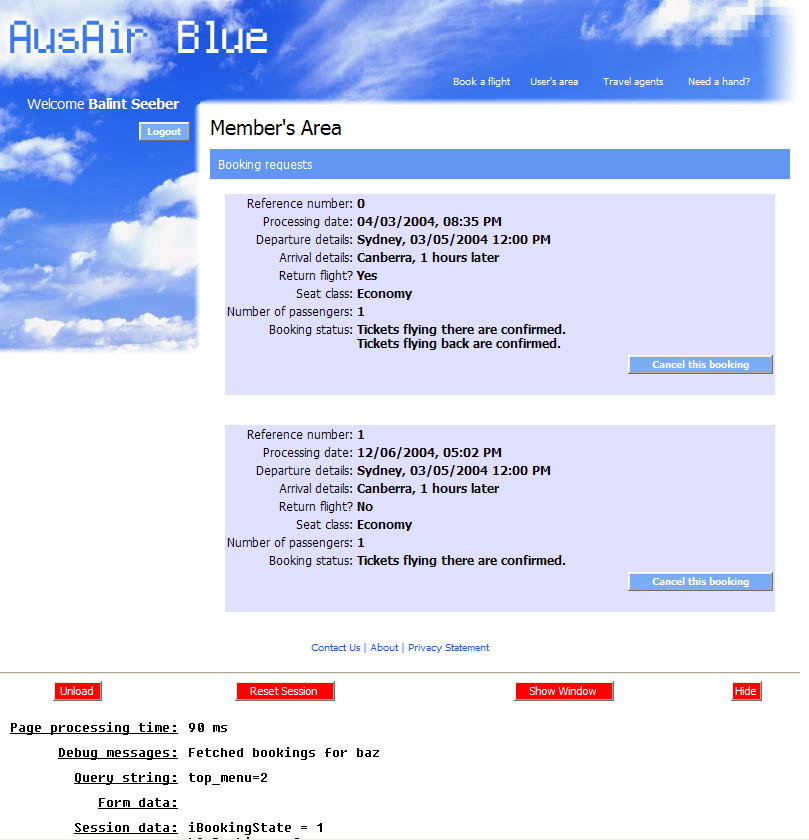
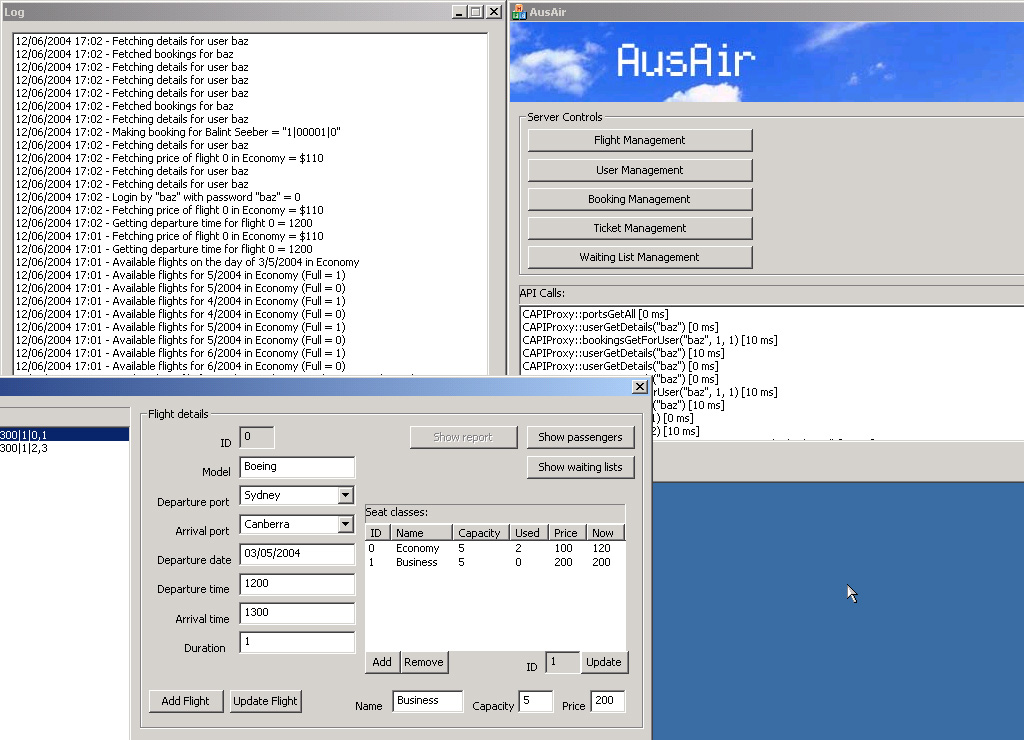
AusAir
Sat, 05/05/2007 - 12:53 — balintClick one of the following images to see the larger version:
|
|
|
|
|
Verlet-integration based particle simulations
Fri, 04/05/2007 - 17:18 — balintI have been continually developing a Verlet-integration based particle system inside Teh Engine and have produced a number of interesting results. The two main themes of simulated phenomenon are tornados and cloth. You can read more about these individual experiments in the next sections, as well as watching videos of the results.
An excellent resource for Verlet-integration can be found at Gamasutra.
Here are some stills:

WebRadio
Fri, 04/05/2007 - 14:20 — balintSKIP THE CHIT-CHAT, LET ME USE IT*!
* Please note: WebRadio is only available when I have the computers and radios switched on. (And I don't usually do this as electricity does not grow on trees and fire is bad. Did I mention I have to pay for uploads too?) If it says it "Can't connect to the server" and you'd like to give it a whirl, please do not hesitate to email me (bottom of front page) and I'll switch it on for you.
VLF Receiver
Fri, 04/05/2007 - 14:13 — balintDr John Smith told me about these types of receivers, so I thought I'd build the bare-bones-basic one.
Unfortunately it's not possible to use it anywhere near urbanised areas due to the 50Hz mains interference 'hum' that swaps out mother nature.
TehDetector
Fri, 04/05/2007 - 14:06 — balintI wrote a Windows-based video analysis and processing framework to underpin the research I undertook for my undergraduate thesis.
Some of the features it boasts:
- DirectShow-based: Enables analysis and process of any video/audio format that DShow supports.
- Seeking with frame-accuracy in an MPEG-2 stream: This handy feature I implemented, when used with certain filters, enables frame-accurate seeking (which otherwise is not possible with the standard filter graph (i.e. source filter and demultiplexer).
- Input live streaming TV: I use a Terrestrial Digital Video Broadcasting card to feed Teh Detector live video, which it processes in real-time. It (obviously) also supports offline analysis of stored content.
- Extensible detector architecture: Detectors (analysis components) can be written in C++ and added at will to the framework to extend its capabilities. I implemented several detectors in a hierarchy fashion to find television commercials in a live stream.
- Automatic frame caching: The framework automatically caches video frames and optimises analysis during runtime by also caching various calculations performed on an incoming frame.
- Event store/viewer: Detectors can output 'events' that describe a detected feature in the video, which is automatically stored and managed by the framework. These events can then later be reviewed in an intuitive manner.
- Lots of others: detector timing profiler, signal strength meter, playback rate control, filter graph management, bookmarking, frame dumping, extensive keyboard shortcuts...
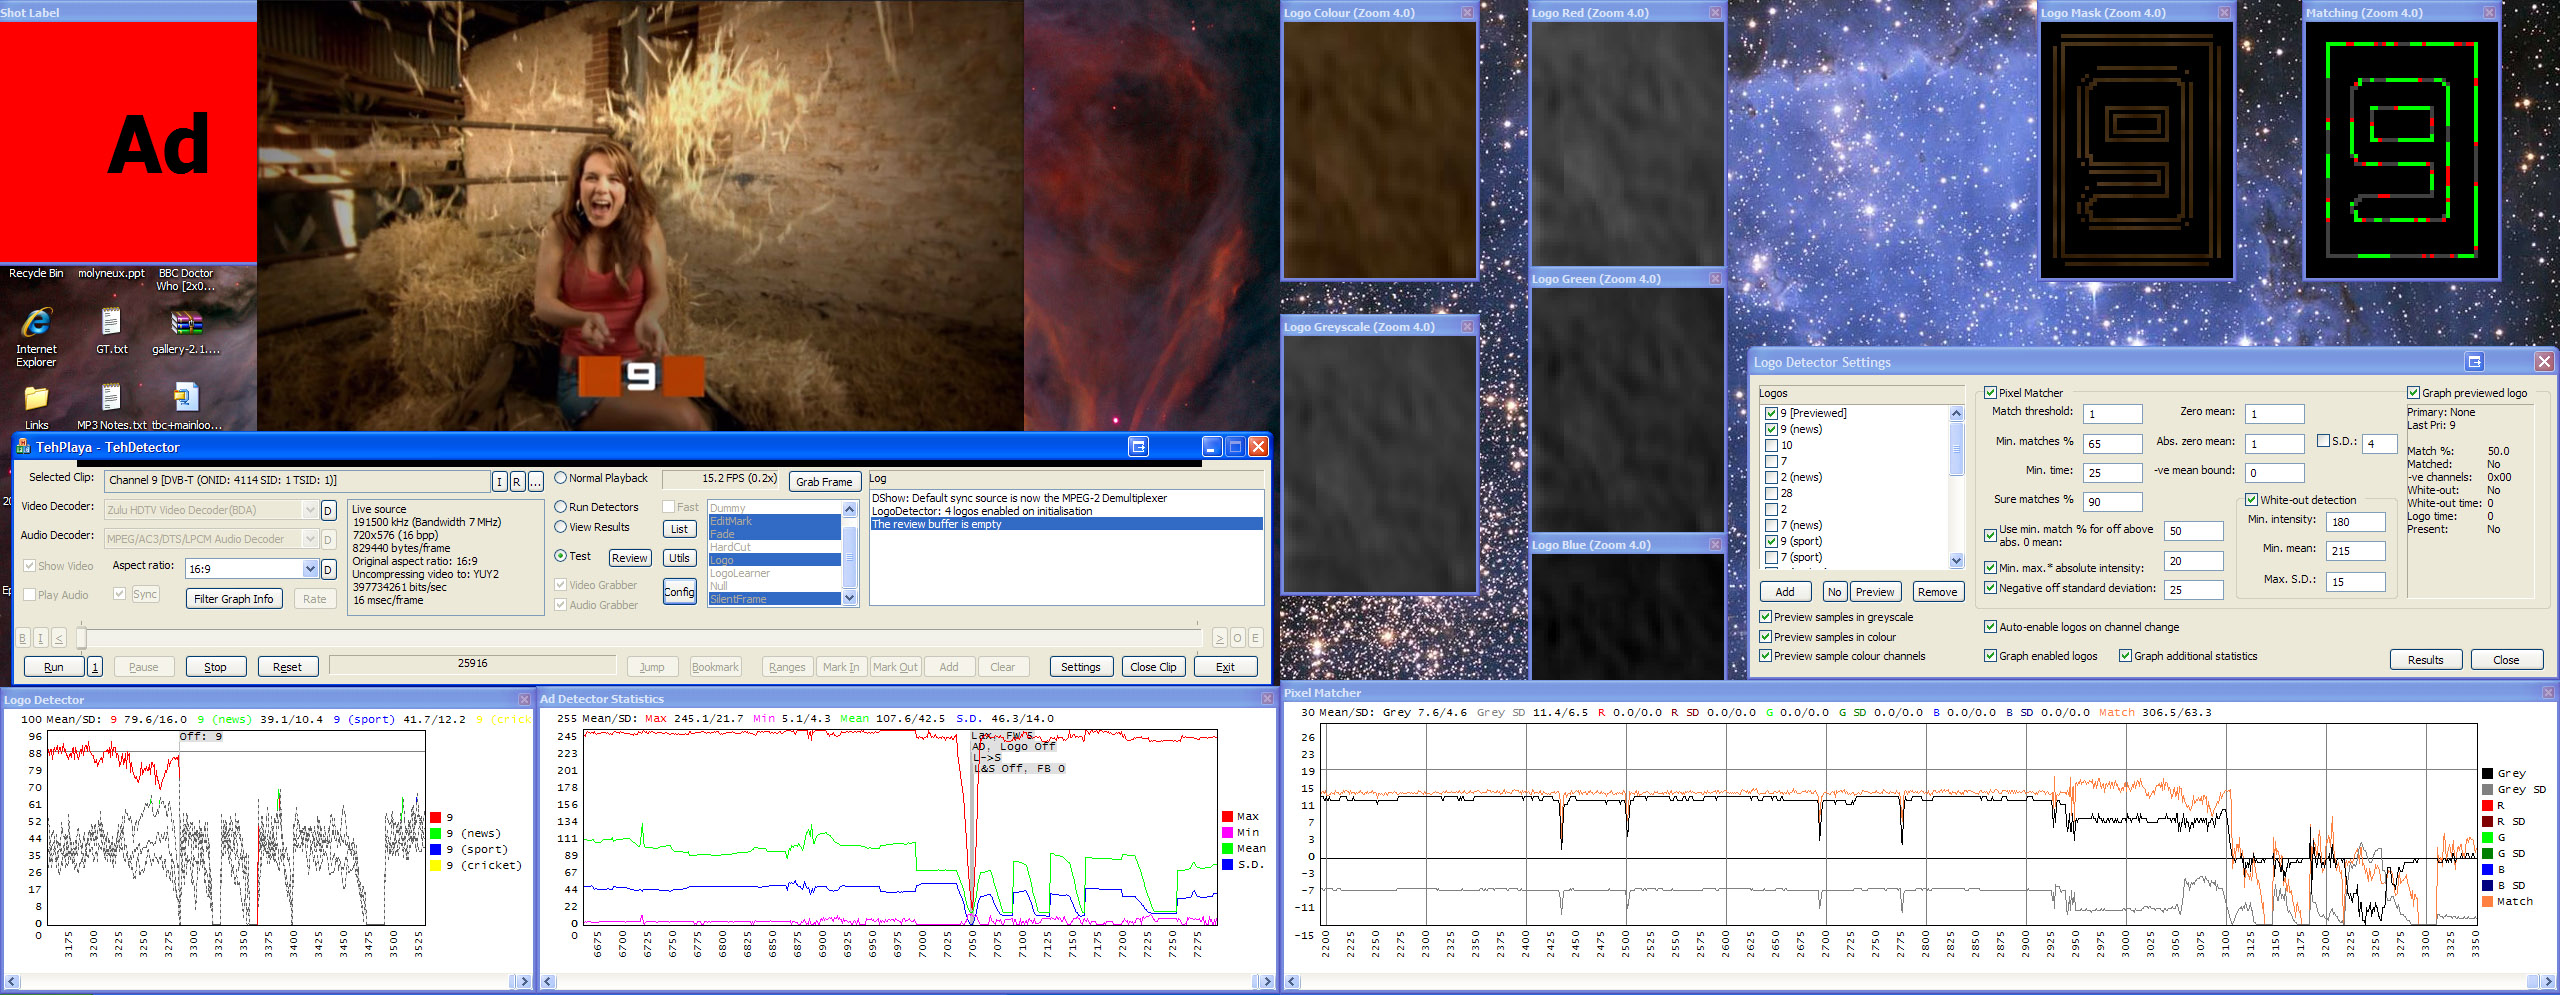
Real-time detection of commercials on television
Fri, 04/05/2007 - 12:35 — balintFor my undergraduate honours thesis I conducted research into the unbuffered real-time detection of commercials on television with a view to muting the volume when ads are being broadcast. The research itself dealt with examining the features required to enable robust real-time detection. I developed a sophisticated video analysis and processing framework to underpin experimentation and compilation of results.
The following screenshots show the system running live (click on one to see the full-res image):
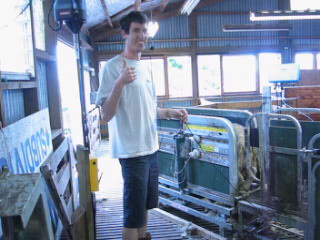
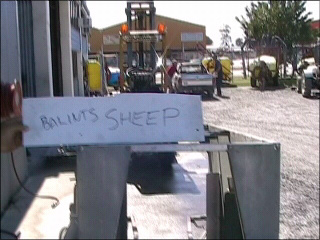
New Zealand hacks
Fri, 04/05/2007 - 11:37 — balintThe last time I visited Wairunga in New Zealand I set about developing two control systems to aid in the running of the farm:
TVisionarium Mk II (AKA Project T_Visionarium)
Tue, 01/05/2007 - 16:13 — balintAn inside view into iCinema's Project T_Visionarium:
(We tend to drop the underscore though, so it's referred to as TVisionarium or simply TVis).
This page summarises (for the moment below the video) the contribution I made to TVisionarium Mk II,
an immersive eye-popping stereo 3D interactive 360-degree experience where a user can
search through a vast database of television shows and rearrange their shots in
the virtual space that surrounds them to explore intuitively their semantic similarities and differences.
Popular content
Today's:
- About
- Turning the Navman S150 into a Bluetooth GPS receiver
- Update
- Simplified Makefile System
- My blog lives elsewhere...
- Making your iPhone look like a NMEA GPS receiver with gpsd and WiFi or Bluetooth
- Restore the MBR and partition information, therefore restoring the file system
- How to recover a RAID 0 disk array after losing the array’s metadata
- Aircraft Tracking with Mode S: Modez & Aviation Mapper
- Australian Geographical RadioFrequency Map
All time:
- About
- How to recover a RAID 0 disk array after losing the array’s metadata
- Making your iPhone look like a NMEA GPS receiver with gpsd and WiFi or Bluetooth
- Aircraft Tracking with Mode S: Modez & Aviation Mapper
- Australian Geographical RadioFrequency Map
- Windows Side-by-Side Assemblies (WinSxS)
- Dual monitor Quake III
- Determine the order of the physical disks in the array
- Tearable Cloth
- Software Defined Radio
Last viewed:
- About
- Update
- Cloth
- Patch for Linux Kernel Orinoco WiFi driver re-enabling original monitor mode with Prism II headers & packet power levels
- Back up relevant data in track 0 from all drives
- My blog lives elsewhere...
- Making your iPhone look like a NMEA GPS receiver with gpsd and WiFi or Bluetooth
- Simplified Makefile System
- WiFi Adventures
- Windows Side-by-Side Assemblies (WinSxS)
AntiSpam spam counter
