Genetic Programming: 3D Visualisation in Python
This is a GUI frontend to the genetic programming assignment given in this subject. The aim is to evolve a wall-following robot. The program provides multiple visualisations of the process. It was written with Janice Leung - many thanks for the beautiful widgets! Developed on (but not for) Linux using Python and its bindings & add-ons: PyQt, PyOpenGL, PIL and psyco. README available. It contains more information about the code used to render the robot & world.
 |
 |
 |
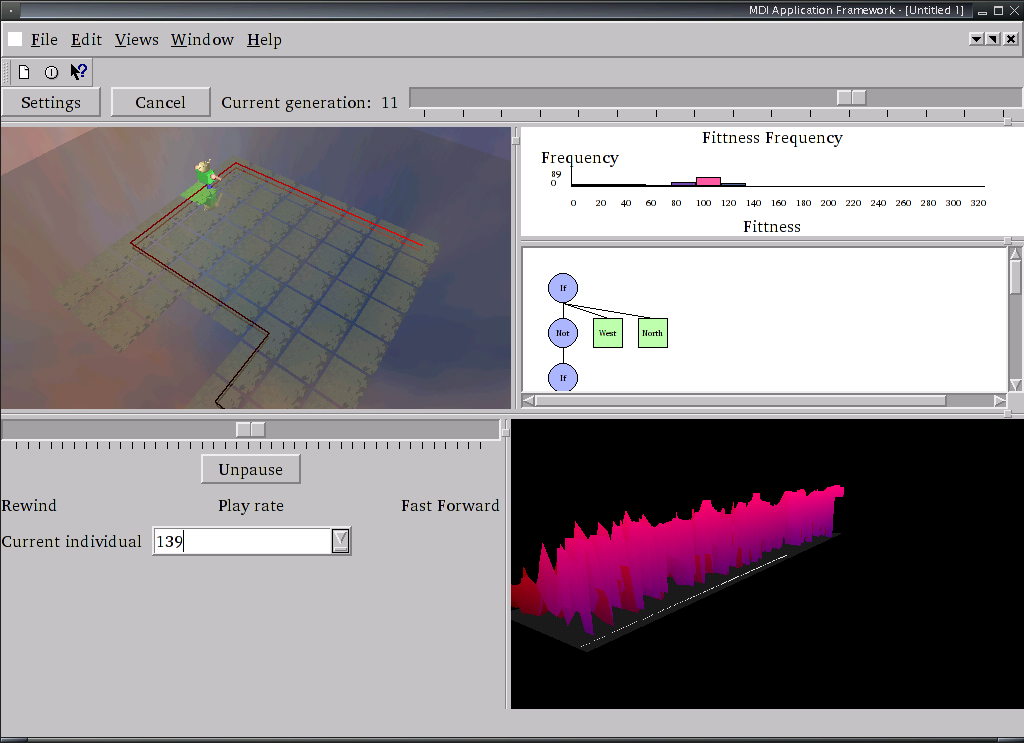 |
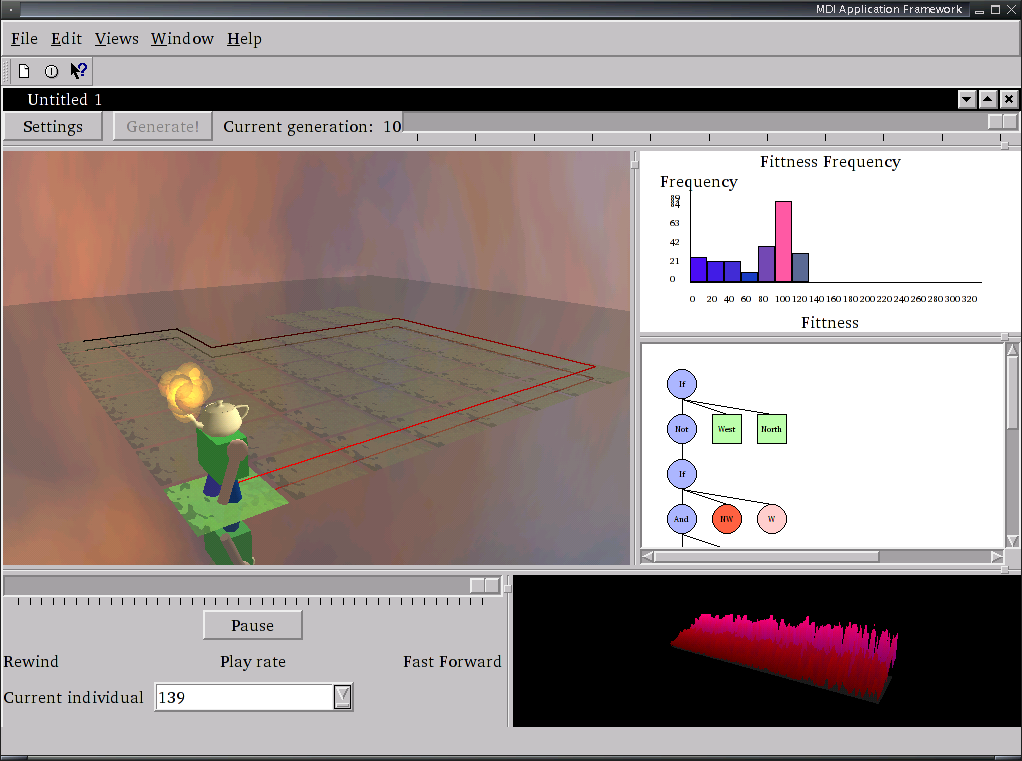
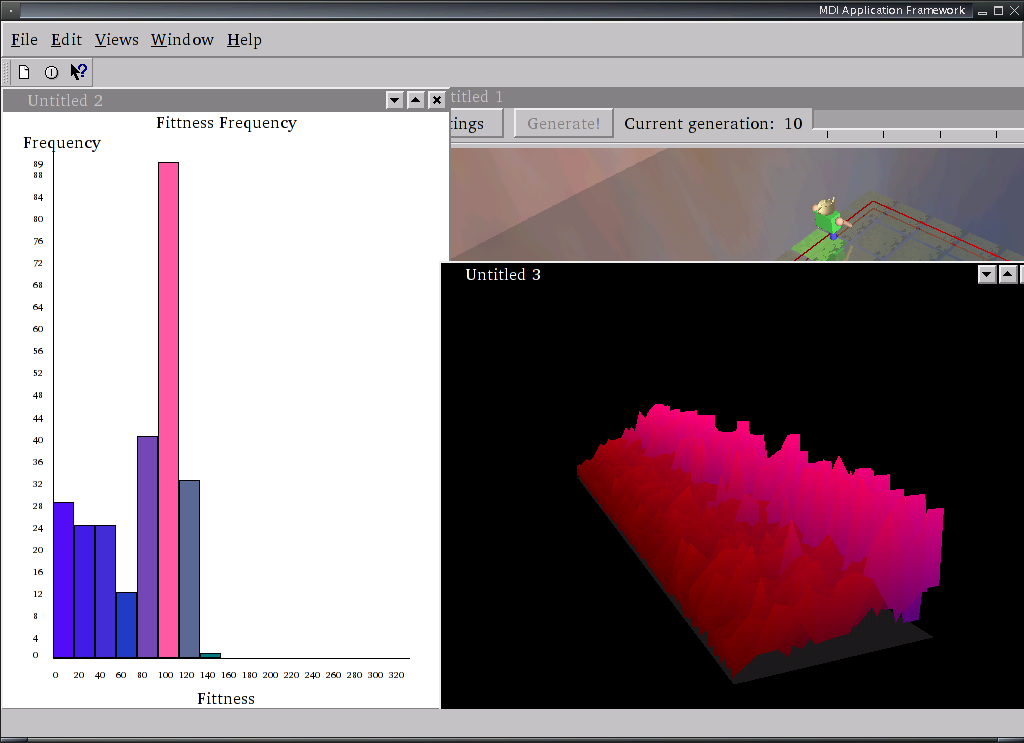
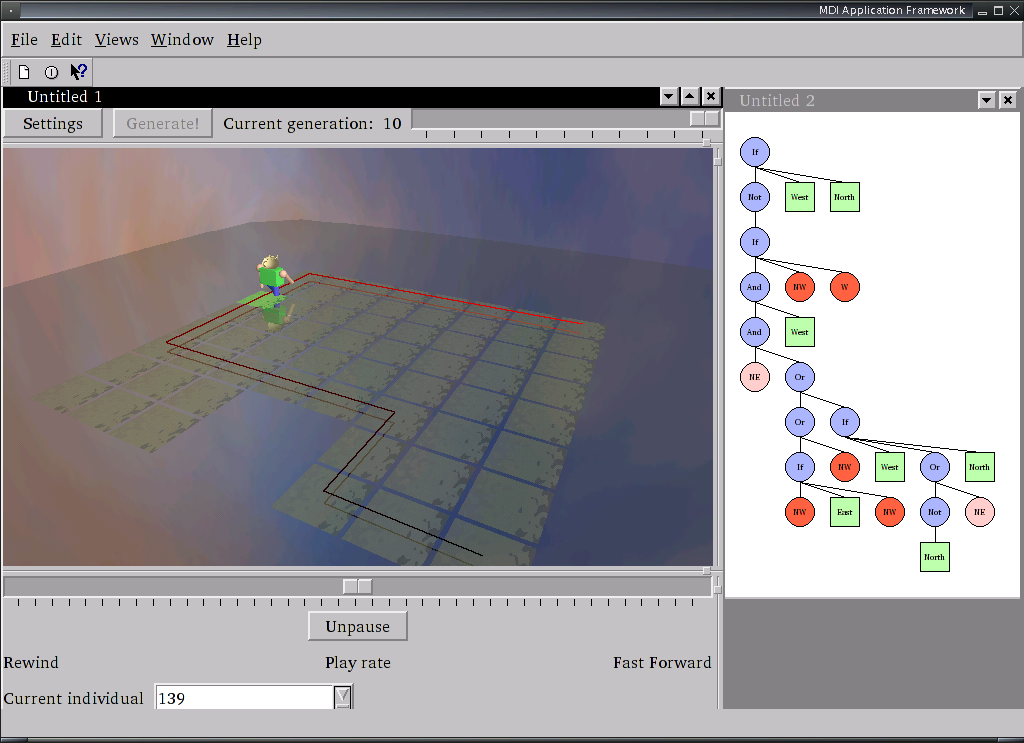
The clickable screenshots above show (from left to right):
- the overall interface (and that the robot has reached a dead-end),
- the robot following a wall and the program graph updating as the robots' sensors change state,
- the 2D and 3D generations graphs displaying the fitness breakdown for each generation in seperate windows, and
- another view of the interface with the views resized.
COMP3141 'Software System Design and Implementation' was run by Amir Michail of CSE at UNSW, Sydney.
The source code and media are attached at the bottom of this page. Make sure you have successfully installed Python and the associated libraries and bindings mentioned above before trying to run this program. Also note there are a number of Python-coded goodies available in the source code:
- Examples of how to render using OpenGL, especially with multiple views
- Using the OpenGL feedback buffer
- A histogram UI widget
- A (node/edge) graph UI widget
- A wrapper for 3D objects (
Model, Texture, Object, Face, Billboard, TextureImage) - A simple particle system (
Particle, ParticleEmitter) - Use of Py3DObject, which is a 3DS Max-model-to-native-Python converter I created
- How to do genetic programming with cross-over, mutation, etc
- An MDI application framework (however this is not ours - it was supplied for the assignment)
I hope this code helps you better understand these concepts and/or teaches you new things, as it did me!
----------------------------------------------
--- README by Balint Seeber & Janice Leung ---
----------------------------------------------

-----------------
--- GP_Imp.py ---
-----------------
    Our GP_Imp2.py has been used in this assignment. Modification has been made to the implementation
to help drawing the program tree in TreeGraph. The modifications are the following:
    - New variables for the program node
        + x and y positions
        + level number
    - New functions for the program node
        + resetData() to reset the new variables added
        + getTreeHeight() to get the height of the program tree
        + getSensorValue() to check whether the direction of the robot is at wall
    We originally attempted to the the Solution 2 from the website, however due to optimisations
    program nodes would be re-used, as were their new tree data (above). This would result in
    tree graphs looking like the nodes had been 'crossed over' too.

--------------------
--- GP_Interface ---
--------------------

    This is an interface to the GP_Imp.py file. As the GP_Imp implementation continuously evolves each generation
    without yielding to other tasks, it is not a good solution that would ensure GUI responsiveness.
    Thus this interface is created to enable iterative evolution over a custom 'step size'.
    After the evolution step is completed, the function returns and the main program can process pending GUI
    events after which it can run the next iteration, and so on, until it finishes the entire process.

-------------------
--- Main Window ---
-------------------
    In the menu, user can select the following:
    - File
    - View
    - Window
    - Help

    + File                   |
        - New                |
        - Open               |
        - Save                > As usual (saving saves all data, once a saved document is loaded,
        - Save As            |  settings will be restored, along with the generation/individual
        - Close              |  last being viewed, previous robot position, etc)
        - Close Document     |

    + View
        - View Histogram        |   When selected, new views of the current tree/graphs will be
        - View TreeGraph         >  displayed. The views will change as the views in the main window
        - View GenerationGraph  |   change (for example, as the current individual/generation is selected or
                                                                    the robot moves around).
    + Window                     |
        - New Window         |
        - Cascade            > As usual
        - Tile               |
        - Close Window       |

    + Help
        - About              | As usual


----------------------
--- SettingsDialog ---
----------------------
    This is the settings dialog which allows user to enter the info as described in the assignment spec.
It will pop up when a new document has been opened/when the user clicks on the setting button in the
ChildFrame. These settings are saved along with the document.
An important feature here is that once an evolution run has been completed, the user can bring back
up the settings dialog, increase the generation count (perhaps altering some other settings) and can
continue running the evolution from where it left off (allowing continuity).

------------------
--- ChildFrame ---
------------------
    It consists of the following widgets which are separated by splitters:
        - GenerationControl
        - RoomView
        - FittnessFrequency
        - TreeGraph
        - VisualisationControl
        - GenerationsGraph

*************************
*** GenerationControl ***
*************************
    This conists of:
        - Settings button
        - Generate button
        - Generation label
        - Generation slider

    + Settings button
    When this is clicked, the setting dialog will pop up and allow the user to set the info.

    + Generate button
    When this is clicked, the program will generate the population as specifed in the settings.
    While the evolution is running, it will appear as a Cancel button. If the user presses this
    the evolution will be cancelled (but not erased). If the user wishes to continue, he/she simply
    has to click it again to finish the rest of the run.

    + Generation label
    This shows the current generation number and will be updated as the evolutionary simulation is progressing.

    + Generation slider
    This shows the current generation number and is acting as the progress bar. Ths slider can be moved to show
    visualization of different generation. Once changed, the histogram will show data for this new generation
    and the individual list in the VisualisationControl area will be updated with the new generation's individuals.

****************
*** RoomView ***
****************
    This is a 3D visualization of the map and the robot.
    When the robot becomes stuck (fails to move indicating a dead-end in the program),
    flames will come out from the teapot head of the
    robot and it will go off when the robot starts moving again (whether backward, retracing it's steps,
    or when a new starting position is selected, or when a new individual is picked).
    By holding the Shift button, user may choose a new position for the robot to walk from with the current program
    by simply clicking on the tile in 3D.

    Controls: Click/select with Left mouse button.
    Click/drag: Left: rotate camera
                Middle: translate
                Right: Zoom
    Mouse wheel: zoom

    The animation/particle system is taken care of by timers set in the widget.
    They cause the engine to tick over and move the robot/particles.
    When the robot moves into a new square, a callback is called which passes through
    the new robot position to the document (which in turn emits a signal to other views
    so they update themselves).
    The trail is drawn so one can see the part it's drawing out (creating by storing the
    positions it walks across as it goes).

*************************
*** FittnessFrequency ***
*************************
    All of the fittness values of one generation will be used to construct the histogram with fittness
as the x-axis and frequency as the y-axis. A dictionary has been used to tally the frequency of the
fittness values when data has been added. When the histogram is drawn, the frequency of a range of
fittness values (depending on the number of bars on the graph) will be added up and stored in a list.
The height of each bar will be depended on the values in the list.
    QPainter has been used in drawing the histogram and QPixmap to store the picture after it has been painted (increased re-draw time).

*****************
*** TreeGraph ***
*****************
    This is the visualization of the program tree. The tree has been first evaluated bottom-up to calculate
the positions of each node. Then the tree will be checked left-to-right depth-first to see if any node will overlap
with one another on the same level. This can be checked by using "getLeftChildOnSameLevel" (with the help
of "getRightmost" tree traversal) to get the node on the left of the current node. If overlapping occurs, then the current
node will be moved accordingly to the right.
    QPainter has been used in drawing the tree and QPixmap to store the picture after it has been painted (increased re-draw time).
Different types of program nodes have been painted with a different color. The sensor node will be painted a darker red
if that sensor node is active as the robot walks across the map.
    Resizing is automatic (depending on the tree size) so the widget is embedded in a scroll view for easier viewing.

****************************
*** VisualisationControl ***
****************************
    This consists of:
        - Robot play rate slider (with Pause)
        - Current Individual ComboBox

    + Robot play rate slider
    The speed of the robot movement on the map can be manipulated by sliding the bar. The travels of the robot
can be fast forwarded (to the right of centre), rewound (to the left of centre) or stood still (middle, or click 'Pause').
    If Paused, click Unpause to resume with the last rate setting.

    + Current Individual ComboBox
    It has a list of the fittness of the current generation population (descending order). By selecting different individual, a
different tree will be displayed and the robot will move according to the new individual's program tree.
    (The robot will start moving from the same startin position as the previous tree unless a new one is set).

************************
*** GenerationsGraph ***
************************
    This is a 3D graph with generation as the z-axis (depth), individual as the x-axis (going across) and fittness as the z-axis (going up).
    This uses very basic 3D drawing to draw 'quads' (4-sided polygons) with height given by the surround individual's fitnesses in current/next
    generations.
    The camera controls are the same as the RoomView.

****************
*** 3D NOTES ***
****************

    OpenGL was used to render the 3D graphics. (PyOpenGL bindings to make it work in Python).
    The Python Image Library was used to load textures (required to load more advanced images, eg: Targas
    for use of alpha (tranparency) maps.
    A point to mention is that the ThreeD.py file was written as a general wrapper for rendering basic
    objects/scenes in Python. This is used to render the various parts of the robot individually, applying
    rotational transforms on certain objects to make it's arms/legs move.
    The origin of the actual 3D data itself is worth note:
    Any arbitary model can be created using a 3D animation program. A program was then written to open this model
    export from the animation program and then convert it into a Python code file that actually contains the raw
    3D data (including references to used textures).
    The program uses two such converted files: 'sky.py' and 'character.py'
    These files contain the raw 3D data which is interpreted by the ThreeD wrapper so that a simple '.render()'
    on the scene can be called to make it display on screen.
    The advantage is that a new, more complex, textured character could be created and simply dropped into the directory
(replacing the existing character) and the new model would appear - no change to the code is necessary!| Attachment | Size |
|---|---|
| GeneticTeapot.zip | 1.39 MB |
| program_dead_end.png | 161.03 KB |
| generation_graphs.png | 94.16 KB |
| active_sensors.png | 174 KB |
| running_evolution.png | 133.6 KB |
Popular content
Today's:
- About
- Turning the Navman S150 into a Bluetooth GPS receiver
- Simplified Makefile System
- Update
- Making your iPhone look like a NMEA GPS receiver with gpsd and WiFi or Bluetooth
- Restore the MBR and partition information, therefore restoring the file system
- How to recover a RAID 0 disk array after losing the array’s metadata
- Geolocation Experiment using the Mobile GSM Cellular Network
- My Bicycle
- Australian Geographical RadioFrequency Map
All time:
- About
- How to recover a RAID 0 disk array after losing the array’s metadata
- Making your iPhone look like a NMEA GPS receiver with gpsd and WiFi or Bluetooth
- Aircraft Tracking with Mode S: Modez & Aviation Mapper
- Australian Geographical RadioFrequency Map
- Windows Side-by-Side Assemblies (WinSxS)
- Dual monitor Quake III
- Determine the order of the physical disks in the array
- Tearable Cloth
- Update
Last viewed:
- Update
- About
- NISRP: the Non-Intrusive Song Rating Plugin for Winamp and iTunes
- How to recover a RAID 0 disk array after losing the array’s metadata
- T_Visionarium (AKA Project TVisionarium Mk II)
- Correctly lit, textured cloth: Torn Up
- Winrad ExtIO input for USRP
- Windows Side-by-Side Assemblies (WinSxS)
- My Bicycle
- Genetic Programming: 3D Visualisation in Python
AntiSpam spam counter
