For myself
Mode S in the US
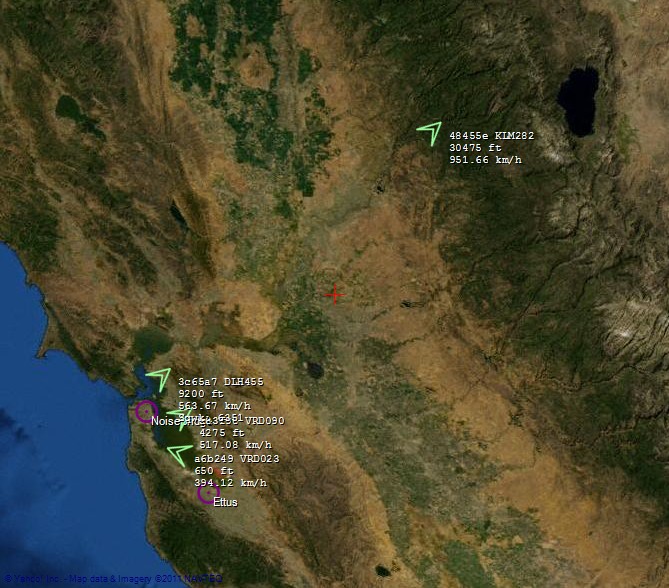
Sun, 24/07/2011 - 15:37 — balintSan Francisco & Silicon Valley:
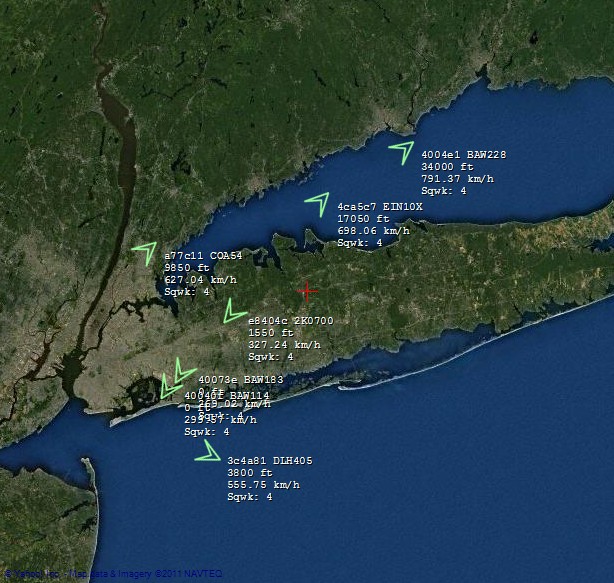
New York, New York:
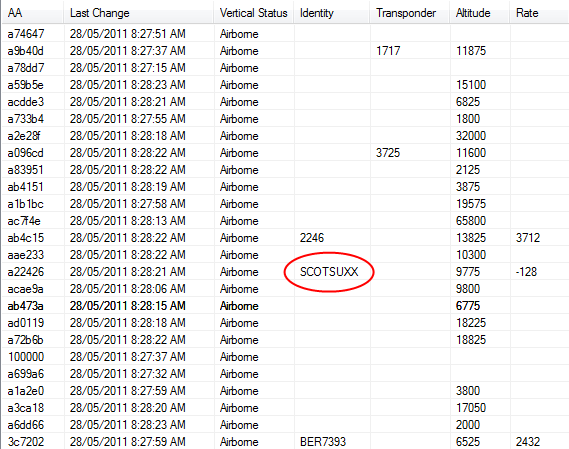
SCOTSUXX:
AviationMapper Demo
Tue, 24/05/2011 - 13:43 — balintAviation Mapper is LIVE! Click here to use it.
The Aviation Mapper launch video
Running live at Sydney Airport streaming AvMap via 3G mobile Internet
Running the Aviation Mapper desktop app
Presentation at Dorkbot Sydney Finale 2011
Presentation at Ruxcon 2011: "Hacking the wireless world with Software Defined Radio
BorIP
Sun, 22/05/2011 - 20:15 — balintBorIP* is a software solution that abstracts a streaming SDR interface to make it available over an IP network, allowing the SDR hardware to be physically removed from the front-end processing computer(s). The goal for BorIP is to keep the protocol simple.
For instructions, help and more technical information (such as the complete protocol breakdown), please visit the wiki page.
You can get the server, along with the ExtIO_USRP plugin, from the download page.
Winrad ExtIO input for USRP
Sun, 22/05/2011 - 20:02 — balintWinrad and its forks (HDSDR & WRplus) are software radio interfaces that run on Windows. They support a number of SDRs as input sources (known as ExtIO plugins). There was previously one for the USRP, however I decided to write a new one with UHD and legacy support, and much more (e.g. remote control and streaming over a LAN).
Software Defined Radio
Sun, 22/05/2011 - 19:42 — balintMy Software Defined Radio experiments featured in GQ Australia (April/May) 2012!

SDR-powered Aviation Mapper is now LIVE! Click here to use it.
The Aviation Mapper launch video
Have a look at my Hi-Def intro video on using SDR on HF that was featured on Slashdot:
(The 'cheap SDR' they refer to can be found on my wiki for GNU Radio/Linux and Windows.)
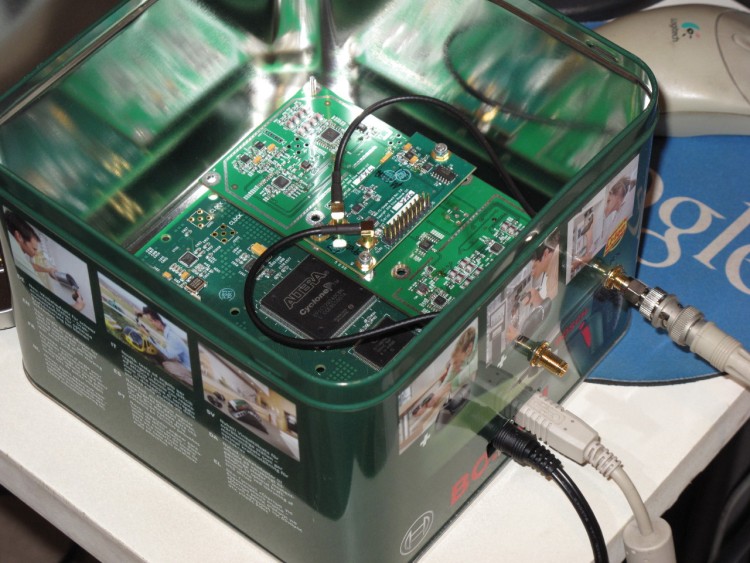
The Software Defined Radio (SDR) I currently use is the Universal Software Radio Peripheral (USRP) 1 made by Ettus Research (in a custom housing!):
I've used it for several of my projects, including an aviation tracking system with a live streaming 3D Google Earth front-end:
Demonstration of BorIP network streaming between HDSDR and GNU Radio using USRP 1:
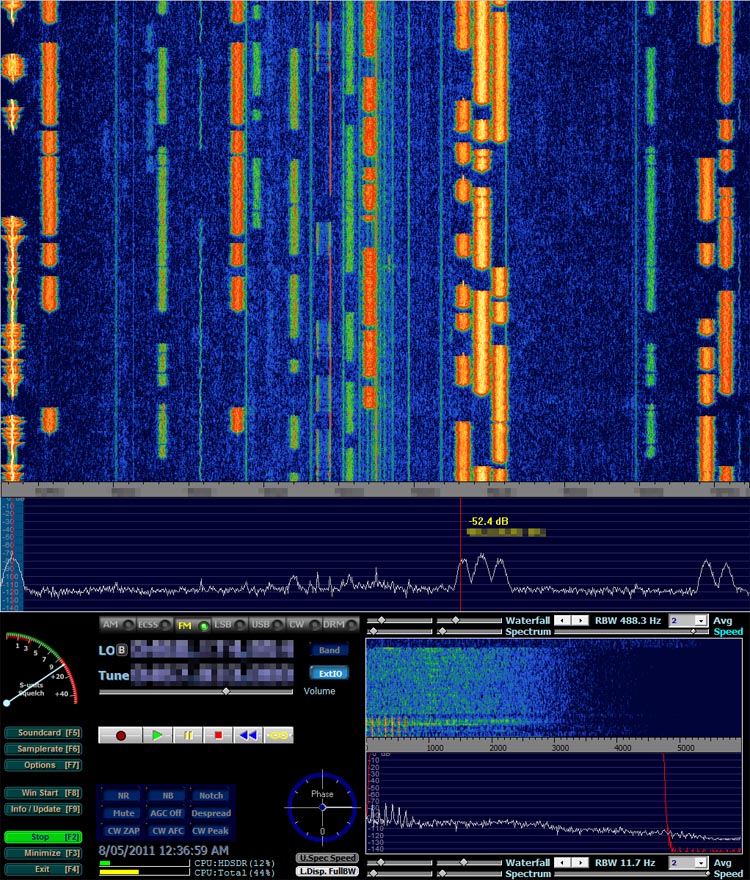
Example of HDSDR using USRP:
Presentation at Dorkbot
Fri, 05/11/2010 - 23:39 — balintHere are some excerpts of the presentation Matt Robert and I gave at the October 2010 meetup of Dorkbot Sydney.
If you wish to see all of the photos from the set-up phase prior to the presentation on the roof of my apartment block, please have a look at the album in my gallery.
The Early Days
Sun, 17/10/2010 - 16:06 — balintThese are screenshots from the first working version of the system. You'll notice one obvious bug: some of the altitudes are impossibly high (the was an extra un-necessary bit shift).
If you wish to see photos of the first proper outdoor test of the system on top of the tallest hill in Sydney Park, please have a look at the album in my gallery.
Aircraft Tracking with Mode S: Modez & Aviation Mapper
Sun, 17/10/2010 - 15:50 — balintAviation Mapper is LIVE! Click here to use it.
The Aviation Mapper launch video
This project is a completely home-grown implementation of an aircraft tracking system using Mode S messages received on a Universal Software Radio Peripheral (USRP) from Ettus Research. The system comprises of a software-defined baseband decoder, a GUI front-end and a real-time (smooth) JavaScript-enabled Google Earth feed.
For the Mode S/aviation/RF enthusiast: If you are interested in various notes, diagrams and screenshots that are more technical than these series of pages, please check out the dedicated page on my wiki as well.
Modez, Aviation Mapper and Software Defined Radio featured in GQ Australia (April/May)!
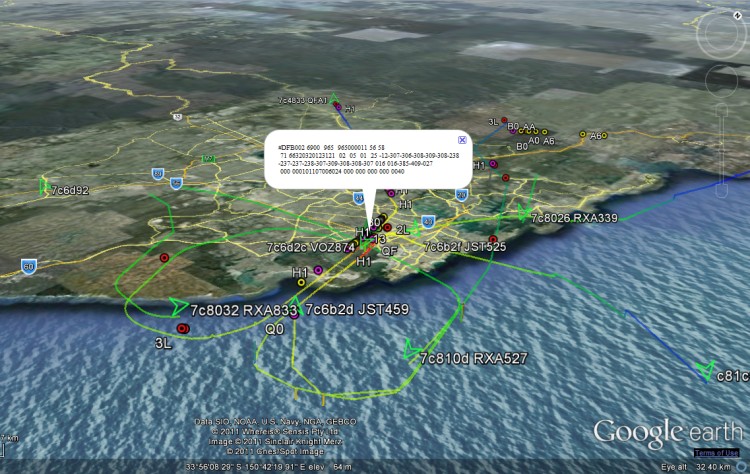
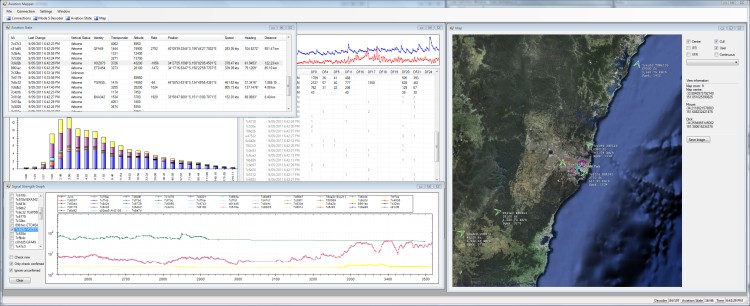
Screenshots from the GUI front-ends:
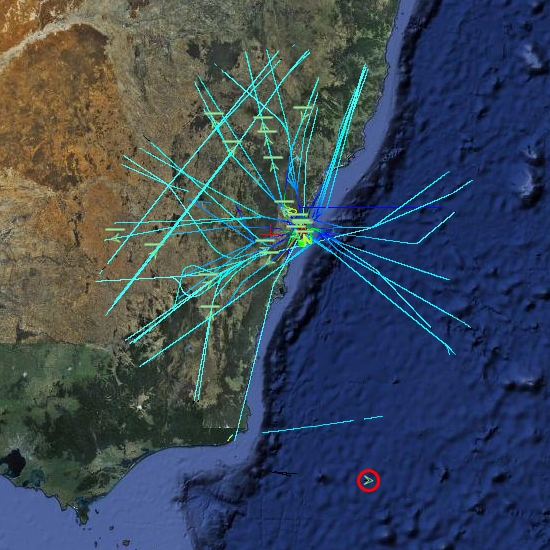
A plane at 514 km, with trails left behind showing flight corridors
Looking at an angle at Sydney Airport, with planes landing on overlapping approach trails.
ACARS messages shown spatially as coloured dots with message label and content in balloon pop-up.
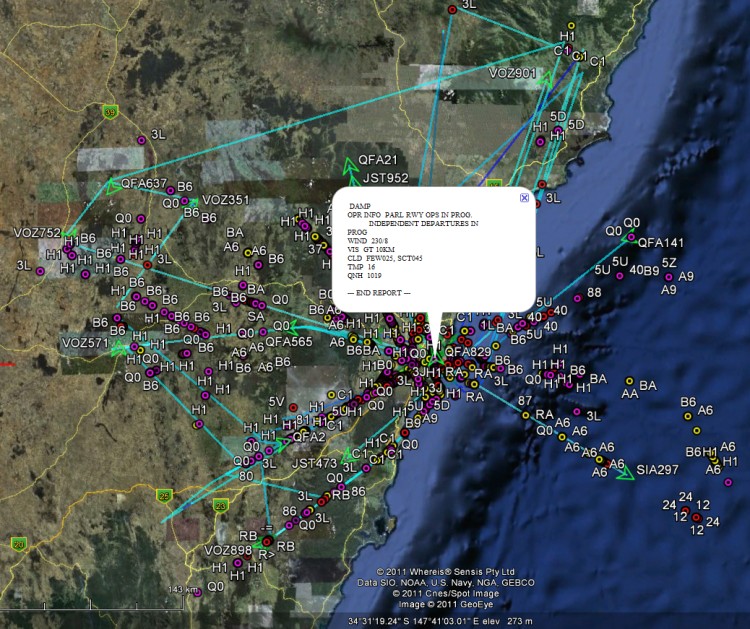
Spatial representation of ACARS message transactions building up over half a day
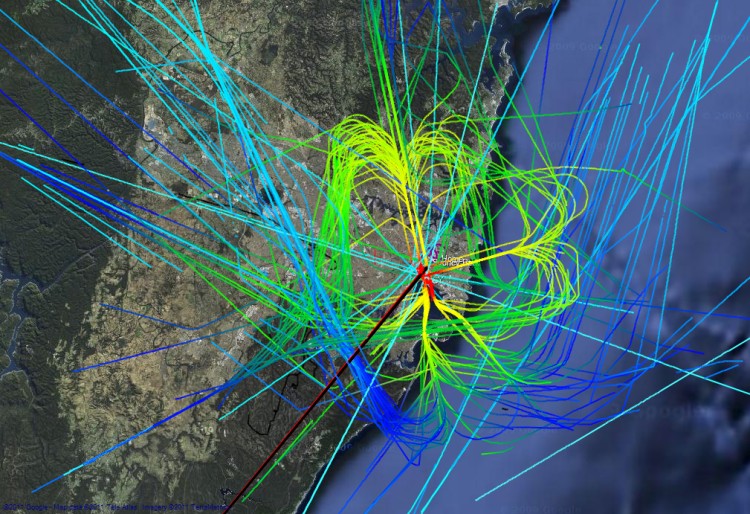
Accumulated flight paths over half a day
The Aviation Mapper desktop app
Australian Geographical RadioFrequency Map
Tue, 15/06/2010 - 23:55 — balintRFMap featured in GQ Australia (April/May 2012)!
You can also have a listen to this podcast of a radio interview I did on with Ian Woolf on 2SER:
"Balint Seeber Mashed Up Radio"
UPDATE: I have written an extensive guide with plenty of screenshots explaining how to use the map to the full. The contents of the guide can be found to the left of this text (at the top of this page's left-hand column). Read it if you wish, or dive right in. Alternatively, open two tabs/windows and go through the guide while trying it out live.
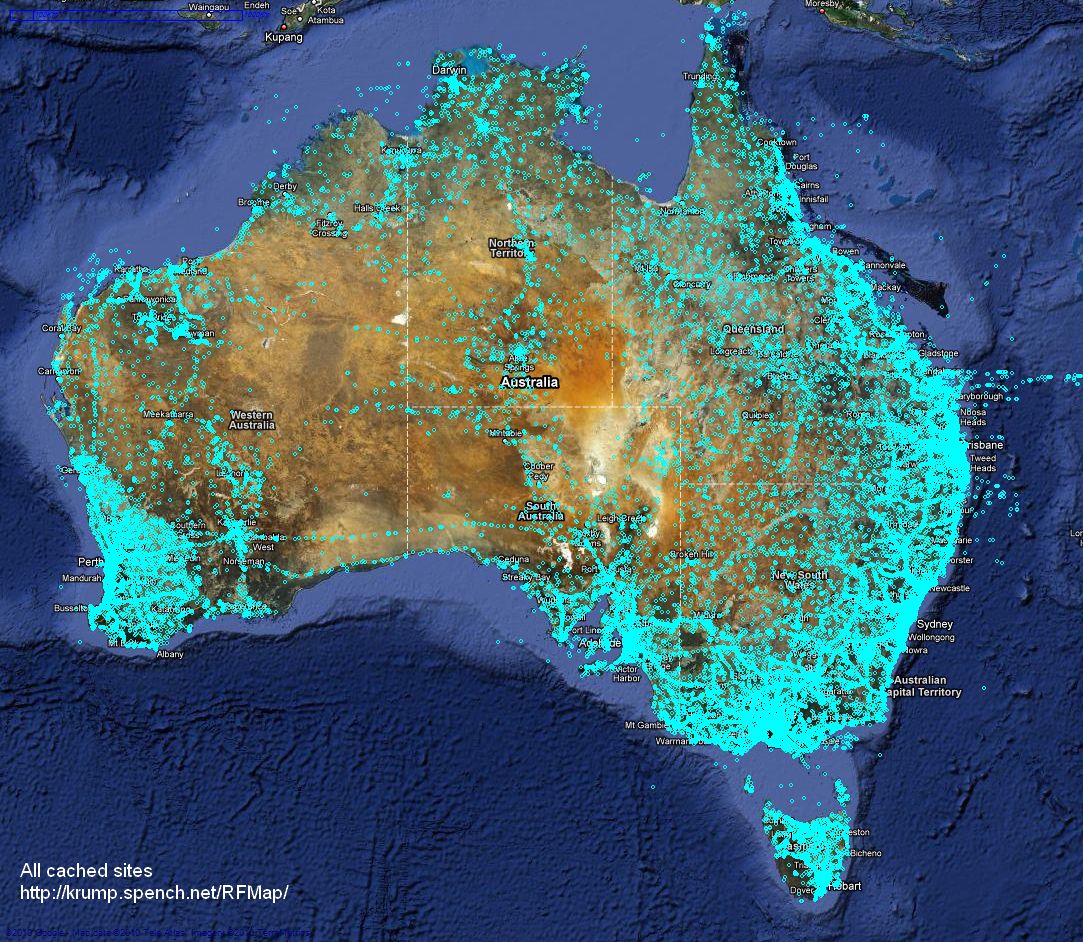
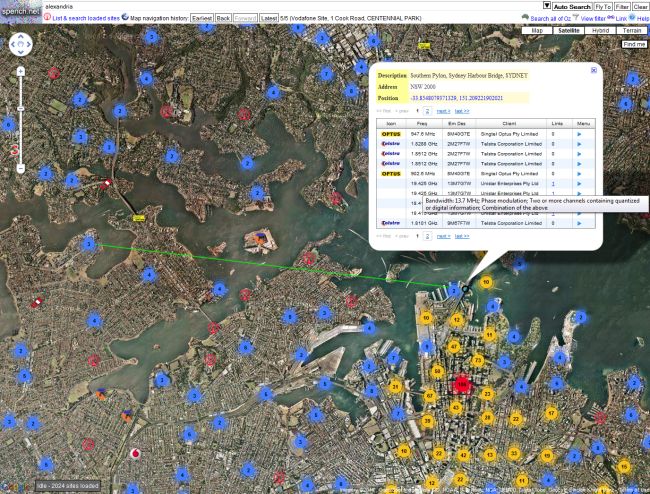
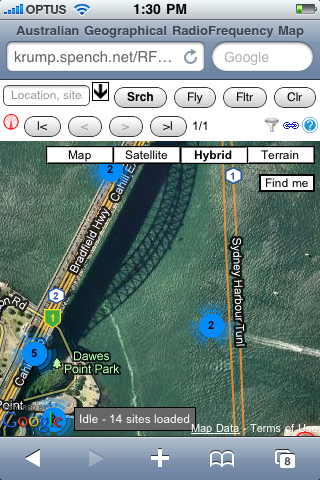
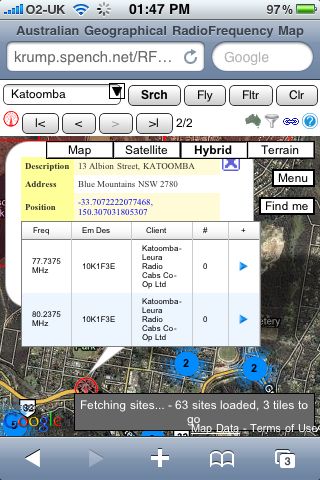
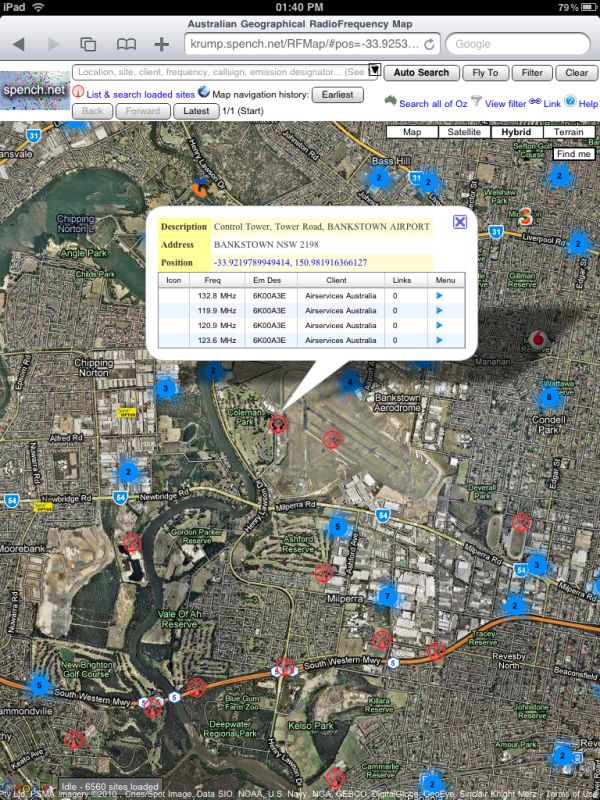
The Australian Geographical Radio Frequency Map is a site that overlays all registered RF transmitters on top of Google Maps. Generic antenna sites are shown with the red RF icon, while mobile base stations are represented by the carrier that operates from the site (often multiple carriers do, but currently the first is chosen when determining the icon). A mouse-over will give you the site's description, and a click will tell you who broadcasts from there, and at what frequencies. Much more is to come...
Although people by-and-large won't be terribly interested in the positions of every antenna in the country, they might be interested in checking how close they are to their nearest mobile base station, how good a carrier's coverage is in a particular area, and for prospective spectrum purchasers to assess possible interference, etc. However, having said all that, it is primarily in the ham spirit.
Here is every transmitter site cached in the database, which is fully searchable from the web interface (shown below) by location, site name, client details, frequency range, emission designator and callsign:
Here is a browser preview:
Here is what it looks like on the iPhone:
And on the iPad:
NISRP: the Non-Intrusive Song Rating Plugin for Winamp and iTunes
Thu, 04/03/2010 - 18:39 — balint| UPDATE: NISRP has now been added to the offical Winamp plugin catalogue! |
More information is available on my wiki.
Mapping Software
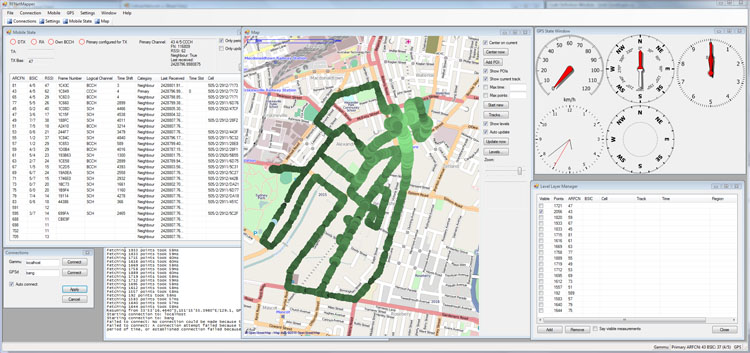
Wed, 24/02/2010 - 22:05 — balintThe mapping software brings all the data together and presents it on a map. Position and measurements are logged to a SQL database, and can be reviewed at will. The 'Level Layer Manager' allows customisation of data shown on the map. For example, one can choose to plot all measurements made on a particular ARFCN, and then further refine that to one cell by specifying the BSIC.
Collecting the data
Wed, 24/02/2010 - 18:04 — balintTwo streams of data are of interest: trace information from the mobile and position information from a GPS receiver.
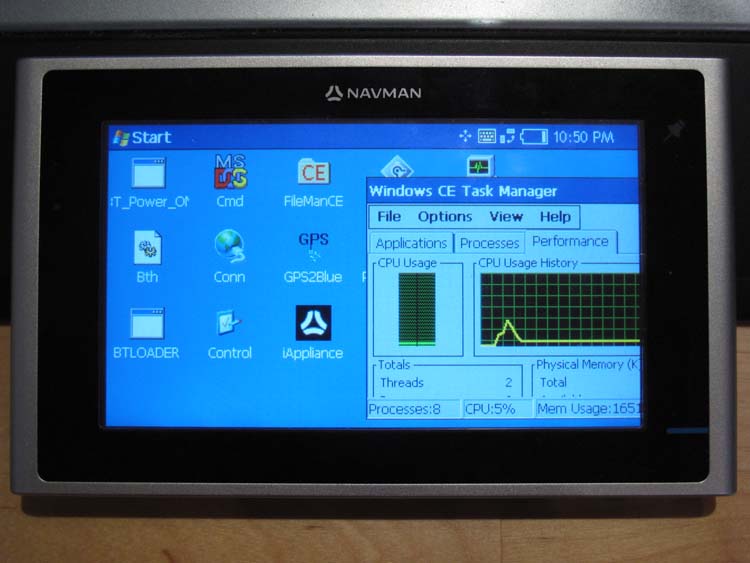
To acquire position information, I used a commercial Navman device, which was modified to boot into WinCE and transmit NMEA data over a TCP connection (via Bluetooth Dial-Up Networking and GPS2Blue) to a virtual serial port on my laptop, which in turn was connected to gpsd. Full details can be found here.
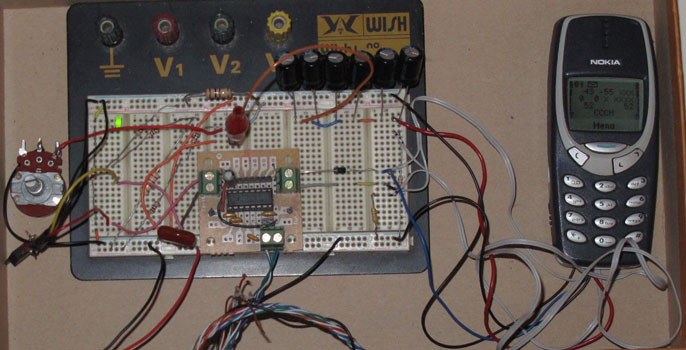
Hardware
Tue, 23/02/2010 - 13:38 — balintAn old Nokia mobile with DCT-3 firmware (for network monitor mode) is required. The phone needs to be connected to a computer via its FBUS serial interface, so some level conversion hardware is also required. Since most modern laptops do not have an external serial port, an RS-232 to USB converter is also a good idea.
Geolocation Experiment using the Mobile GSM Cellular Network
Tue, 23/02/2010 - 12:49 — balintThis experiment involved acquiring CellID and signal strength information from the GSM cellular network, tracking one's position while acquiring this data, and finally presenting it nicely. It is summarised in the following pictures (full details are described in the sub-sections found top-left):
Mapping position and signal strength measurements:

Turning the Navman S150 into a Bluetooth GPS receiver
Wed, 27/01/2010 - 14:18 — balintNavman GPS receivers, and the like, are great, until you actually want to use their received GPS data on a computer in real-time. Luckily there are plenty of resources to do this (NavmanUnlocked, the forum, MioPocket, GPSPasSion and GPSUnderground). In addition, I recommend SiRFTech for GPS testing. There are many tools available too, such as SSnap, which is extremely useful to track registry and filesystem changes. This is especially good when creating a one-off .reg file that you can import after a hard reset to restore the state of WinCE (in particular Bluetooth pairings).
Here, I give a quick guide to turning a Navman S150 into a Bluetooth GPS receiver that one can use with gpsd on a Bluetooth-enabled computer.
Behold the trusty S150 running WinCE Core 5 and PNADesktop (which is launched from \Program Files\Navman\appstartupsec.ini - the other apps, e.g. SmartST, are manually disabled):
Making your iPhone look like a NMEA GPS receiver with gpsd and WiFi or Bluetooth
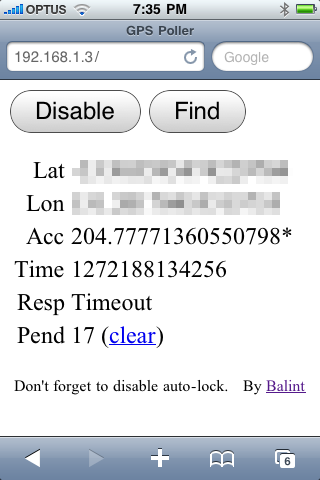
Wed, 27/01/2010 - 12:36 — balintTRY IT OUT: If you wish to test the front-end interface on your mobile device, click here and tap 'Find' (not 'Enable'). This is handy if you want to check how well your location service is working, and to get raw lat/lon values! Please note: this will not allow you to send the position updates to your computer - this is purely for your testing only.
UPDATE 2: I have enhanced the web interface further so it supports time-outs and the ability to clear the update backlog that is accumulated following a timeout (see new screenshot below). Thank you to Ryan K for additional testing.
Unfortunately there appears to be a bug that is manifest under Linux: if gpsd is run with no clients connected and updates are sent from the phone, the script will lock up when attempting to send updates to gpsd after an arbitrary period of time. In the short term, this can be fixed by connected to gpsd and sending it a command (e.g. the 'watch' instruction). If a client is connected to it (which should be the case in nearly all circumstances) this doesn't seem to happen. This behaviour has not been seen under Windows.
Preliminary tests on Mac OS X are reported to be successful. If installing gpsd via a package manager, be sure to disable auto-startup (via init.d scripts and/or hotplug, etc) otherwise the gpsd instance launched by the Python script will not be able to bind to the normal listener port and you will be left wondering why you're not getting any data (as you'll be connected to the wrong gpsd instance).
UPDATE 1: I have uploaded a new version of the package (new Python and HTML). The new features include:
- asynchronous updates (no more locking up Safari)
- batching of updates (which should solve the Bluetooth problem described below), and
- filtering of duplicate updates (you will see an asterisk * next to the 'Acc' value, as in the screenshot).
Many thanks to 'gabe' for testing! Also, please be aware that the HTTP server opens files from the current working directory of the Python process. If you're seeing 404s then your current directory is probably not the same as where the script is (you can check the current directory when it is printed out upon starting the Python script).
I was suprised to find that seemingly none of the dedicated GPS iPhone apps could stream your current location to a computer. Therefore I knocked up this simple solution, which uses a Python script to wrap up gpsd and make it think it's connected to a real GPS receiver that outputs NMEA sentences. The receiver is of course the iPhone, which uses Javascript (to retrieve location) and basic AJAX (to send the results to the Python script) all running in Safari. The page is served from Python (running on a computer) via WiFi or a tethered connection (Bluetooth or cable). Please note that Python and gpsd are not running on the iPhone - only the web browser is. This is what you would see in Safari once the page has been loaded from the Python web server:
Patch for Linux Kernel Orinoco WiFi driver re-enabling original monitor mode with Prism II headers & packet power levels
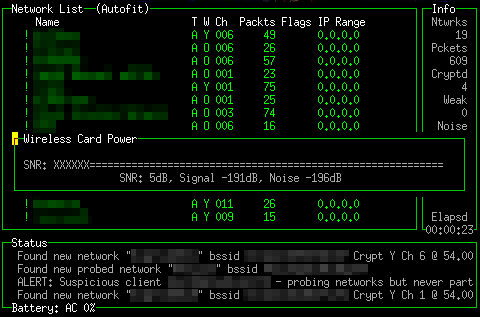
Tue, 01/12/2009 - 11:18 — balintI was disappointed to find that the improved Linux Kernel Orinoco drivers do not report power levels via the standardised iwconfig 'monitor mode'. When the iwpriv 'monitor' mode was available, Prism II packets were sent from the driver to userland. These packets contained extra information reported by the hardware, such as per-packet signal & noise levels. I think having SNR measurements is one of the most useful features of Kismet, as it allows to you roughly determine the direction to a network based on signal power. Therefore I took the old-style monitor mode code and transplanted it into the modern driver (in kernel version 2.6.23.9). Now both monitor modes are accessible. Kismet picks the older one (Prism II packets) first, before trying the standardised mode.
Without too much fuss, the Kismet SNR meter is back - for example:
TokyoCabinet and TokyoTyrant DLLs for Windows MSVC
Fri, 16/10/2009 - 14:01 — balint
TokyoCabinet (TC) is a wonderful open-source key-value pair database library by Mikio Hirabayashi, part of his TokyoProducts suite. TokyoTyrant (TT) is the networked portion of it (i.e. the database client & server). Since I am working on a project in Visual Studio under Windows and set out to use TC over the network, I needed to access the TT client API with MSVC.
Correctly lit, textured cloth: Torn Up
Sat, 06/10/2007 - 16:20 — balintI fixed the lighting calculations and thought I would use a built-in texture:
Paused Tornado Simulation Fly-thru
Sat, 06/10/2007 - 16:16 — balintHere is a fly-through of the standard tornado simulation with some pretty filaments:
DS with Correct Physics!
Sat, 06/10/2007 - 16:08 — balintShortly after the presentation day, I ripped out the original physics code that someone (who shall not be mentioned!) had written in the minutes prior to the presentation and replaced it with more 'physically correct' code:
Physically Controlled LED Display
Sat, 06/10/2007 - 15:59 — balintA little something I made in my spare time:
(More details coming later...)
Atmel at76c503a Wireless USB Adapter
Mon, 13/08/2007 - 11:53 — balintThis started with my desire to build a Woktenna.
Of course you can't very well put a PCMCIA wireless card at the focal point of a cooking wok!
So the alternative is using a USB WiFi adapter that can hang on the end of a USB extension cable and
introduce minimal analog signal loss and USB is digital!
Despite the fact is says "Linux compatible" on the box, it wasn't immediately possible to do what I wanted to do,
which is: monitor mode!
With monitor mode, I'd be able to point the woktenna around and pick up the beacon frames of distant APs.
I found two drivers available for this device:
one over at BerliOS,
and the other at SourceForge.
WiFi Antennas
Mon, 13/08/2007 - 11:37 — balintI have made the following WiFi antennas:
Cantenna
Made two, same design for both.
Gain is good: ~12dB.
 |
 |
 |
LED Display
Tue, 07/08/2007 - 12:18 — balintThanks to the generosity of Aras Vaichas, I came into possesion of an old (1992) 60x8 dual-colour LED display. As it was just the display itself (no manual, instructions, software, etc) I set about reverse engineering the board. Using my multimeter I re-created the schematic for the board and found all the relevant datasheets online. Having figured out how to talk to the display, I interfaced it via the parallel port and wrote some control software for it. Once I could display various test patterns (multi-colours sine waves), I 'net-enabled' the software so that the display could be controlled over a network via UDP packets - the resolution is so low that the entire LED configuration fits into a single packet! Finally, I wrote a plugin for Winamp that streams the frequency analysis of the playing song to the display, which produces results like this:
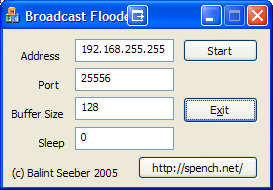
Broadcast Flooder & Network Bandwidth Hammer
Mon, 30/07/2007 - 15:54 — balintMy friend Rafal Kolanski and I decided one night to put our gigabit network cards to the test and measure how quickly a user-space program could generate packets and how many would be discarded before the destination's NIC would receive them. Therefore we wrote a small Linux program to complement my Broadcast Flooder, which I had previously written to test other aspects of my network.
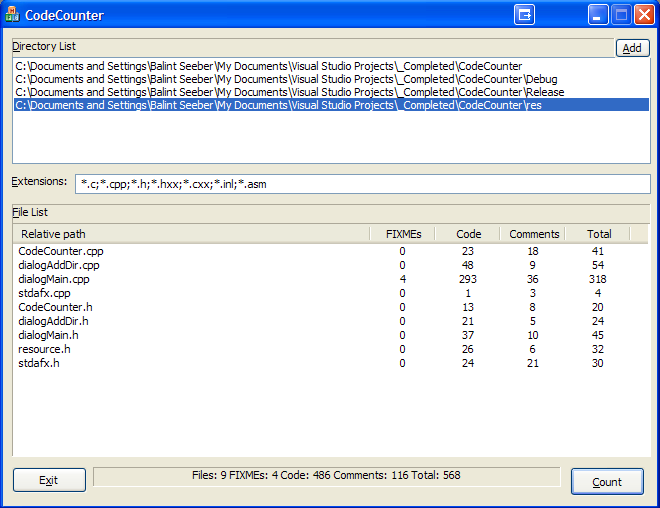
Counting Lines of Code
Mon, 30/07/2007 - 15:09 — balintAlthough there exists a plethora of programs that count lines of code, I thought I would write my own. It is designed to analyse C/C++ code and ignore whitespace, // and /**/ comments (both the single and multi-line sort). It also counts the number of FIXME's one has left in their code. Other languages (eg: Javascript, assembly) that also use such commenting conventions are compatible too.
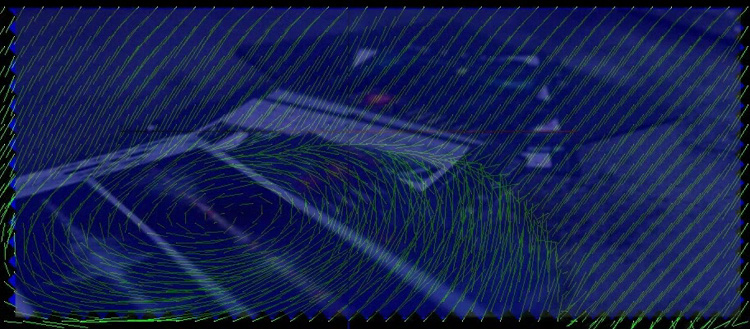
Motion Vector Visualisation
Mon, 07/05/2007 - 18:51 — balintUsing my modified version of ffdshow, which sends a video's motion vectors via UDP to an external application, I visualised the motion vectors from The Matrix: Reloaded inside my fluid simulation. The grid resolution is set based upon the macro-block resolution in the video sequence and each type-16x16 motion vector controls one spatially-matching point on the velocity grid. The following visualisation is taken from the scene where they are discussing the threat to Zion while inside the Matrix before Neo senses that agents are coming (followed by Smith) and tells the ships' crews to retreat.
The final video is on YouTube, with the MVs overlaid on top of the source video.

Blue Milk
Mon, 07/05/2007 - 18:50 — balintThis is the new-and-improved fluid simulation in action. I'm perturbing the 'blue milk' with my mouse. Watch for the darker region form and expand behind the point of perturbation. Due to finer resolution of the velocity grid, the linear artifacts apparent in the earlier version have disappeared and it now looks smooth in all directions.
Popular content
Today's:
- About
- Turning the Navman S150 into a Bluetooth GPS receiver
- Update
- Simplified Makefile System
- Making your iPhone look like a NMEA GPS receiver with gpsd and WiFi or Bluetooth
- My blog lives elsewhere...
- NISRP: the Non-Intrusive Song Rating Plugin for Winamp and iTunes
- Windows Side-by-Side Assemblies (WinSxS)
- Physically Controlled LED Display
- Hardware
All time:
- About
- How to recover a RAID 0 disk array after losing the array’s metadata
- Making your iPhone look like a NMEA GPS receiver with gpsd and WiFi or Bluetooth
- Aircraft Tracking with Mode S: Modez & Aviation Mapper
- Australian Geographical RadioFrequency Map
- Windows Side-by-Side Assemblies (WinSxS)
- Dual monitor Quake III
- Determine the order of the physical disks in the array
- Tearable Cloth
- Software Defined Radio
AntiSpam spam counter
